
This article is Part IV of a set of five technical articles that accompany a whitepaper written in collaboration between Meta and Ekimetrics. Object Detection (OD) and Optical Character Recognition (OCR) were used to detect specific features in creative images, such as faces, smiles, text, brand logos, etc. Then, in combination with impressions data, marketing mix models were used to investigate what objects, or combinations of objects in creative images in marketing campaigns, drive higher ROIs. In this Part IV we explore the MMM methodology applied.
Why you should read this
MMM Process
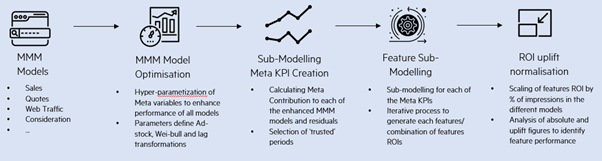
Modelling Workflow
MMM Model
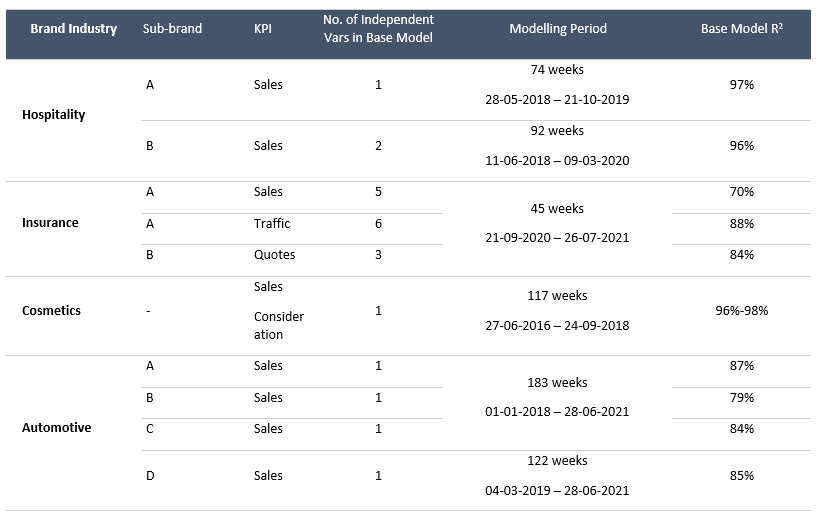
Table 1: Specifications of MMM models selected Detail of Models selected
Meta Contribution to KPI = Coefficient of Meta Variable ×Transformed Meta Variable
The Meta contribution became the dependent variable of the Sub-Model, along with the constant and residuals. The object detection impressions timeseries served as the explanatory variables. The objective of this was to understand the impact of different feature splits into the overall Meta performance, allowing room for movement through the constant and residuals.
A sub-modelling approach allowed for the object detection features to have indirect effects on the KPI, through the Meta variable. Bayesian Optimisation Methods were employed to find the optimal transformations for each variable.
Each Sub-model is a linear regression, testing the impact of the appearance of a feature, or feature group, and its opposite (partner feature) against the total Meta performance. Since the features are not mutually exclusive (between 48%-66% of creatives contained at least two objects), they could not all be tested in the same model. Furthermore, the daily impressions and spend per feature were split according to creative type. That is, the impressions associated with a feature or combination of features, e.g., Person & Product, were split out by static, video and carousel. While it was not in the scope of the study, doing this allowed for further analysis into the impact of features by creative type.
A sequential approach was followed in which each feature group was tested in isolation. Within each sub-model, the transformations of the features (lag, adstock, and diminishing returns) which maximized R2, and minimized p-values were chosen. The transformations that the Meta features follow were bounded to the following ranges: lag of 0-3, adstock of 0-50, saturation (K; S) of 0.1-0.8; 1-9.
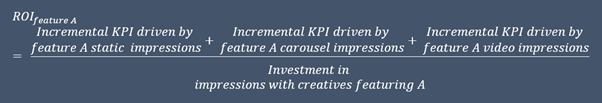
An example of sub-model is shown below.
![]()
Where:
![]()
![]()
Same for Video (V) and Carousel (C)
One major challenge with the approach of testing the appearance of a feature or a set of features against its partner feature (e.g., impressions of creatives where a Brand Cue appears vs impressions of creatives where a Brand Cue does not appear), is that the partner feature is indirectly testing the appearance of other features or no features at all. To manage the risk of results inaccuracy we made sure that:
- Both the main feature and the partner feature in the sub-models had to be statistically significant at a 10% level. For example, if the appearance of a feature is significant but the partner is not, the results of that regression were not used.
- The percent of Impressions of the feature being tested had to be > 5%
ROI Calculations
- Calculate the ROI of each feature (and partnering feature/s) using the contribution and the spend associated with that feature. Because the features were modelled by creative type (static, carousel, and video), the results were weighted by the percent of impressions each type represented over the total of the feature.
- Calculate the ROI of the partnering variable (e.g., No Product)
- Calculate the Uplift:

- Index and rank ROI uplifts a. ROI uplifts are standardized, so they are comparable across brands b. They are then ranked so that #1 is the feature with the greatest uplift (maximum difference between the feature appearing and not appearing).
Results
The results can be found in the whitepaper.
Next article
In the next article, we outline the key learnings from this project, including key paths to success and common pitfalls to avoid.